- By Talibuddin Khan
- Wed, 01 Oct 2025 05:59 PM (IST)
- Source:JND
Smog Stories: The Monsoon season has officially ended in India after four months, with the country receiving eight per cent more rainfall than usual. Now, with the end of the rainfall season, all debates are shifting towards the deteriorating air quality. The national capital, Delhi, which turns into a "gas chamber" during the October-November period every year, has already started seeing a rise in its AQI (Air Quality Index).
During the first 10 days of September, the Central Pollution Control Board (CPCB) data shows AQI in Delhi in the 'satisfactory' and 'moderate' categories. But the situation deteriorated in the second week, with the air quality declining to the 'poor' or 'very poor' category. However, an improvement in the air quality was witnessed during the end days of September, with the AQI recorded in the 'moderate' category.
ALSO READ: Delhi Pollution: DPCC Launches Survey To Track Unauthorised Industrial Units, Waste Burning Sources
For years now, air pollution has become one of the most pressing environmental challenges in India, driven by factors like industrial emissions, vehicle exhaust, construction dust and agricultural stubble burning. The issue mainly persists in north Indian states, including Delhi, parts of Uttar Pradesh, Haryana and Punjab, where AQI drops to hazardous or severe categories every year. Let us try to understand what AQI is and how the air quality is mapped.
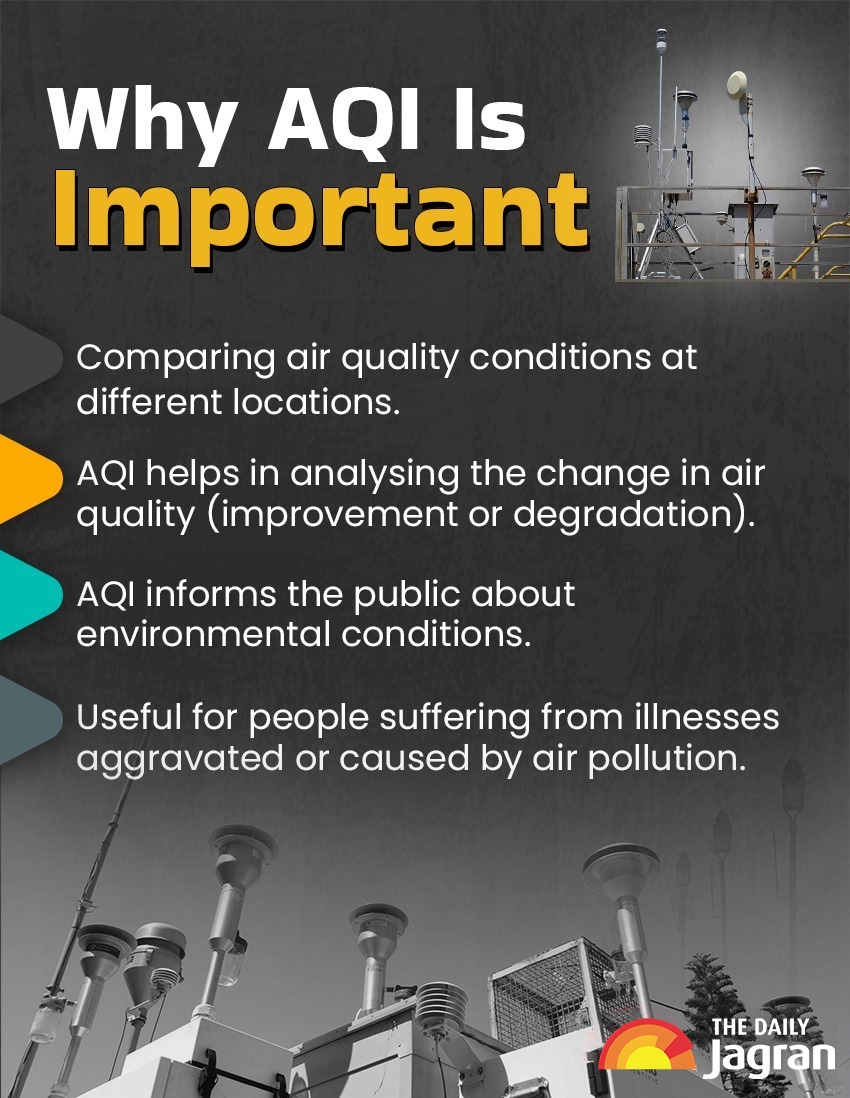
What Is AQI?
The Air Quality Index (AQI) serves as a numerical scale to indicate the level of air quality in a specific area. AQI is calculated based on pollutant concentrations over specific time periods. It converts complex pollution data into simple, understandable categories. It evaluates pollutants such as PM2.5, PM10, ozone, nitrogen dioxide, sulfur dioxide and carbon monoxide, measured over specific periods to determine their impact on health and the environment.
How Is AQI Calculated?
Different countries use different point scales to calculate the air quality index. India uses a 500-point scale, wherein a rating between 0 and 50 is considered good, while a rating between 301 and 500 is deemed hazardous or severe plus.
Air monitoring stations installed at various locations record the concentration of major pollutants like PM2.5, PM10, NO2, SO2, CO, O3, NH3, and Pb in the atmosphere. Each pollutant’s concentration is converted into a sub-index using standard AQI breakpoints. This shows how harmful that pollutant is on a scale of 0–500.
The highest sub-index among all pollutants is taken as the overall AQI for that location. The category (Good, Moderate, Poor, etc.) depends on this final value.
What Are The Major Pollutants?
The Central Pollution Control Board (CPCB) determines the Air Quality Index by tracking five key pollutants that have nationally prescribed standards to protect public health. For each of these pollutants, an AQI score is calculated based on its measured concentration. The pollutant with the highest score then defines the overall AQI for that location.
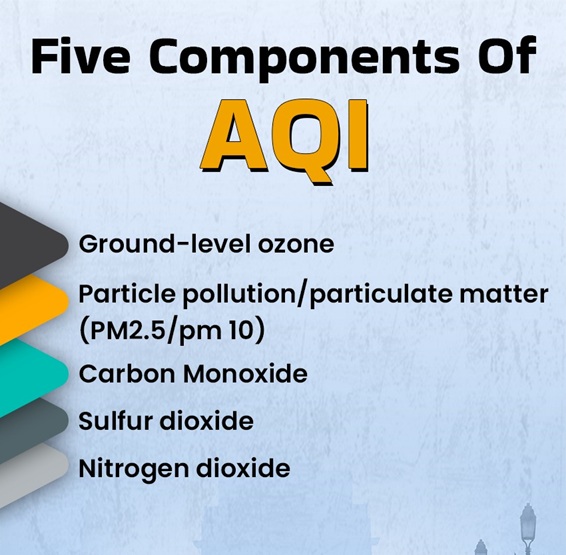
These five air pollutants are:
1. Ground-level ozone (O3): A harmful pollutant formed when sunlight reacts with pollutants like nitrogen oxides and volatile organic compounds.
2. Particle pollution/particulate matter (PM2.5/PM10): Tiny particles suspended in the air that can penetrate deep into the respiratory system. While PM 10 particles have a diameter of 10 microns or less, PM2.5 particles have a diameter of 2.5 microns or less.
3. Carbon Monoxide (CO): A toxic gas resulting from the incomplete combustion of fossil fuels.
4. Sulfur dioxide (SO2): A gas released by industrial processes and burning fossil fuels.
5. Nitrogen Dioxide (NO2): Emitted from vehicles and industrial activities.
ALSO READ: NCR Air Pollution: CAQM Deploys Flying Squads In Punjab, Haryana To Stop Stubble Burning
AQI Categories And Their Impact On Health:
Good (0–50) - Minimal Impact
Satisfactory (51–100) - This may cause minor breathing difficulties in sensitive people.
Moderately polluted (101–200) - May cause breathing difficulties in people with lung disease like asthma, and discomfort to people with heart disease, children and older adults.
Poor (201–300) - May cause breathing difficulties in people on prolonged exposure, and discomfort to people with heart disease.
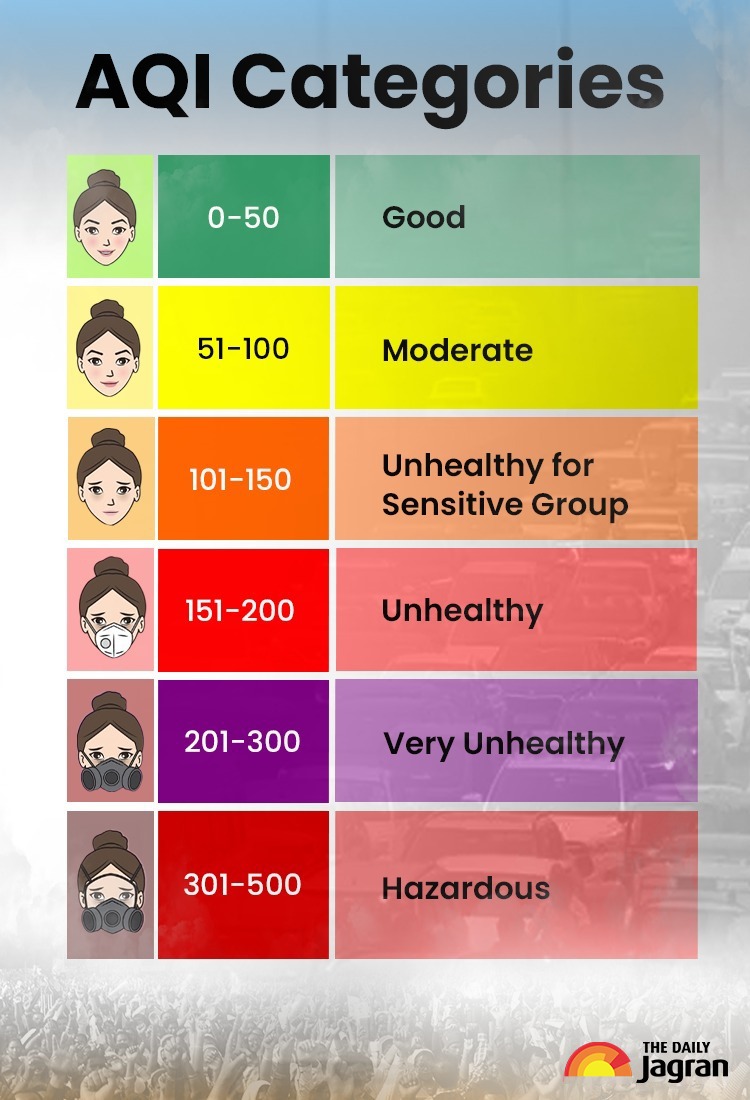
Very Poor (301–400) - May cause respiratory illness in people on prolonged exposure. The effect may be more pronounced in people with lung and heart diseases.
Severe (401-500) - May cause respiratory issues in healthy people, and serious health issues in people with lung/heart disease. Difficulties may be experienced even during light physical activity.
(This article is part of the series 'Smog Stories'. To read more articles in the series, click here.)