- By Yashashvi Tak
- Thu, 27 Nov 2025 08:33 AM (IST)
- Source:JND
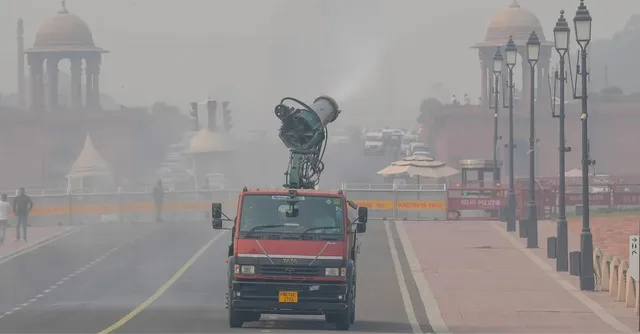
Delhi Air Pollution Today: Delhi's Air Quality Index (AQI) was recorded at 351, classified as “very poor”, at 8 am on Thursday, as per the Central Pollution Control Board (CPCB). Pollution levels rose again after GRAP Stage 3 was lifted following a slight improvement on Wednesday. Several areas, including Bawana, Rohini and Wazirpur, even touched the "severe" category.
In Delhi-NCR, AQI levels also remained high: Indirapuram, Ghaziabad recorded 386 (very poor), Greater Noida 370, Hapur 376, Meerut 320, Muzaffarnagar 351, Noida 369, Gurugram 325 and Faridabad 231.
ALSO READ: Bengaluru Power Cut Today: Shutdown Announced By BESCOM; Check List Of Areas
Although some improvement was observed over the past two to three days, leading the Commission for Air Quality Management (CAQM) to withdraw GRAP Stage 3 restrictions, the air quality continues to remain in the "very poor" range.
Area-Wise AQI In Delhi-NCR
Akshardham recorded an AQI of 390 (very poor), Dhaula Kuan 356 (very poor), Anand Vihar 390 (very poor), Vivek Vihar 395, Jahangirpuri 392, Narela 388, Burari 368, Chandni Chowk 368, Sonia Vihar 355, RK Puram 354, IGI T3 301, Alipur 356, ITO 357, Ashok Vihar 388, Bawana 405, Chandni Chowk later touched 371, Jahangirpuri 394, Lodhi Road 323, Okhla 351, Rohini 400, Punjabi Bagh 377, R K Puram 356 and Wazirpur 406, according to CPCB data recorded around 7 am.
Delhi-NCR Weather
After recording the season’s coldest morning on Wednesday, Delhi is set to remain chilly on Thursday, November 27. According to the India Meteorological Department (IMD), the minimum temperature is expected to stay between 8-10 Degree Celsius, while the maximum may reach 23-25 Degree Celsius. On November 26, the city registered a minimum of 8 Degree Celsius, the lowest November temperature in the past three years and about 3.3 Degree Celsius below normal. In comparison, the lowest November temperature in 2022 was 7.3 Degree Celsius. Winds will remain light, blowing from the north at around 0-10 km/h.
AQI Chart With Possible Health Impact
0-50 (Good): Minimal impact
51-100 (Satisfactory): Minor breathing discomfort to sensitive people
101-200 (Moderate): Breathing discomfort to people with lung issues, asthma, and heart diseases
201-300 (Poor): Breathing discomfort to most people on prolonged exposure
301-400 (Very Poor): Respiratory illness on prolonged exposure
401-500 (Severe): Affects healthy people and seriously impacts those with existing diseases