- By Deeksha Gour
- Wed, 22 Oct 2025 05:39 PM (IST)
- Source:JND
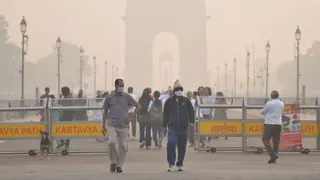
Delhi AQI: A thick layer of smog covered Delhi on Tuesday morning, just a day after Diwali celebrations filled the sky with fireworks. The city woke up to an acrid haze, reduced visibility and burning eyes, as air pollution levels reached hazardous levels. The national capital topped the list of the world’s most polluted major cities, with residents struggling to breathe even indoors.
Contrasting AQI Readings
While Swiss-based monitoring agency IQAir reported Delhi’s Air Quality Index (AQI) at a shocking 1,121, India’s Central Pollution Control Board (CPCB) recorded a much lower 351, which falls under the “very poor” category. Despite the vast difference, experts say both readings are technically accurate, as they follow different measurement methods and scales.
How AQI Works
The Air Quality Index (AQI) is a tool used to explain air pollution levels in simple terms. It is calculated based on eight pollutants, PM10, PM2.5, Ozone (O3), Sulphur Dioxide (SO2), Nitrogen Dioxide (NO2), Carbon Monoxide (CO), Lead (Pb) and Ammonia (NH3).
The NDTV report cited Environmental expert Mohan George as explaining that AQI readings help people understand the air quality through colour-coded ranges. “AQI is designed for the public. It simply shows whether the air is clean or hazardous and guides citizens on what precautions to take,” he said.
Different Scales, Different Results
India’s AQI scale is capped at 500, with anything beyond that marked “severe”, meaning a health emergency. CPCB divides AQI into six categories from ‘good’ (0–50) to ‘severe’ (401–500).
In comparison, IQAir uses a stricter international scale, where values above 301 are considered hazardous. IQAir’s readings can also extend well beyond 500.
ALSO READ: Lucknow Air Pollution: City Breaks 5-Year Record With 'Severe' Diwali AQI
Data Sources And Calculations
CPCB gathers data from government monitoring stations run by CPCB, DPCC, IMD and IITM, using reference-grade instruments. IQAir, meanwhile, collects data from both official and private sensors, including those installed by embassies and individuals.
Experts say that since IQAir includes more data sources, its readings tend to be higher.
For example, if PM2.5 concentration reaches 1,100 µg/m³, IQAir’s calculator shows an AQI of 2,043, while CPCB’s scale limits it to around 1,054, which is finally grouped under the “severe” category.
Experts recommend focusing on labels such as “very poor”, “severe”, or “hazardous” rather than specific numbers.