- By Aditi Priya Singh
- Thu, 06 Nov 2025 03:18 PM (IST)
- Source:JND
Caste-Wise Population Of Bihar: Bihar Legislative Assembly Election 2025 is in full swing, as its first phase is going on 6 November 2025, and the second will be on 11 November. In Bihar, Caste demographics have always been an important topic in election strategies and voter alignments. New information about the population share of different castes in Bihar has been made public by the 2022 Bihar Caste-Based Survey. Depending on which community has the largest numbers and where their support may fluctuate, political parties are now adjusting their alliances and messaging.
While some discussions focus on the broadly grouped categories like OBC (Other Backward Classes) and EBC (Extremely Backward Classes), a closer look at individual caste populations—such as the Yadavs, Rajputs, Brahmins and Bhumihars—provides a clearer view of the electoral equation. It is now more important than ever for voters and observers alike to understand not just party manifestos but also the underlying demographics shaping them.
Broader Caste Categories in Bihar
* Other Backward Classes (OBCs): ~27.12% the population.
* Extremely Backward Classes (EBCs): ~36.01%.
* General (Forward) Castes: ~15.52%.
Together, OBC + EBC groups account for around 63% of Bihar’s population, making them the largest socio‐political bloc.
Recommended For You
-1762416481426_m.webp)


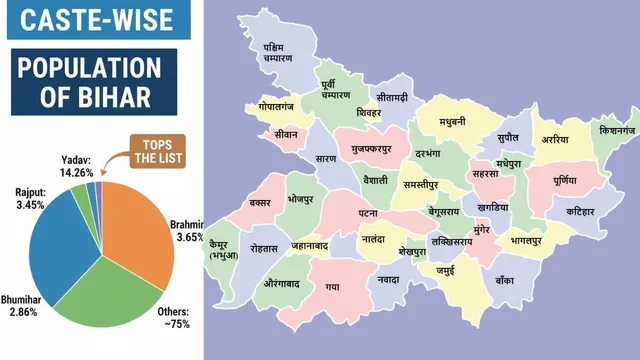
Individual Caste-Wise Population Of Bihar
Here are some of the major caste groups in Bihar and their approximate population shares as per the 2022 survey:
* Yadavs: Around 14.26% of the state’s population.
* Rajputs: About 3.45%.
* Brahmins: Around 3.65%.
* Bhumihars: Approximately 2.86%.
According to this data, the Yadav community is the largest identifiable caste group listed, with smaller shares of traditional "upper-castes" like Brahmins, Rajputs, and Bhumihars.
Major Individual Castes In Bihar
Here is the table list of caste wise population in Bihar. Check which group has the highest population.
| Caste | Population | Percentage (%) |
|---|---|---|
| Yadav | 18,650,119 | 14.2666% |
| Dushadh | 6,943,000 | 5.3111% |
| Ravidas | 6,869,664 | 5.2550% |
| Kushwaha (Koeri) | 5,506,113 | 4.2120% |
| Brahmin | 4,781,280 | 3.6575% |
| Rajput | 4,510,733 | 3.4505% |
| Musahar | 4,035,787 | 3.0872% |
| Kurmi | 3,762,969 | 2.8785% |
| Bhumihar | 3,750,886 | 2.8693% |
| Teli | 3,677,491 | 2.8131% |
| Mallah (Nishad) | 3,410,093 | 2.6086% |
| Bania | 3,026,912 | 2.3155% |
| Kanu | 2,892,761 | 2.2129% |
| Nonia | 2,498,474 | 1.9112% |
| Kayastha | 785,771 | 0.6011% |
Source: Bihar Caste Survey 2022
Why These Numbers Matter
*Electoral impact: Parties are interested in gaining support from Yadavs because they make up the largest individual caste share.
*Representation and policy: Greater representation in welfare, employment and politics may be demanded by larger population groups.
*Social dynamics: Despite their smaller numbers, many members of the upper castes still hold political and economic sway.
What the Data Suggests
Since the Yadavs are the largest caste group on the list, they may have more clout in coalition politics. Although they are fewer in number, the upper castes still control a significant portion of the land, the economy, and politics, indicating a disconnect between numbers and power. Parties will probably use these caste numbers when crafting their messaging, seat splits and coalitions for the 2025 election.