- By Yashashvi Tak
- Thu, 23 Oct 2025 08:26 AM (IST)
- Source:JND
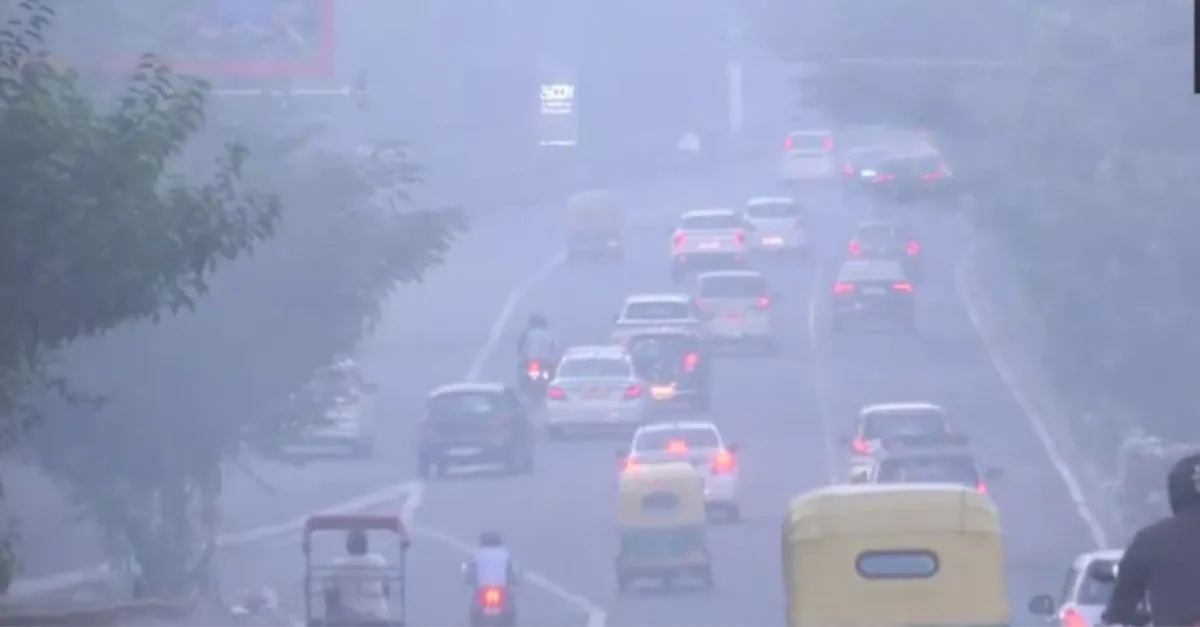
Delhi Air Pollution: The air quality in Delhi remained in the ‘Very Poor’ category for the fourth consecutive day on October 23, as per the Central Pollution Control Board (CPCB), three days after Diwali festivities. According to aqi.in, the city’s average AQI stood at 325 at 5:30 am on Thursday, with most areas in the red zone. Several parts of the national capital reported AQI levels between 300 and 400, falling under the ‘Severe’ category. Anand Vihar recorded the worst air quality, with an AQI of 511 early Thursday morning.
The AQI scale classifies air quality as:
Good (0-50)
Satisfactory (51-100)
Moderately Polluted (101-200)
Poor (201-300)
Very Poor (301-400)
Severe (401-500)
Experts have advised residents to limit outdoor activities in the National Capital Region (NCR) until air quality improves to at least the ‘Moderate’ range.
#WATCH | Delhi | The Air Quality Index (AQI) around Akshardham was recorded at 350, in the 'Very Poor' category, in Delhi this morning as per the Central Pollution Control Board (CPCB) pic.twitter.com/vG7qpCxZ1o
— ANI (@ANI) October 23, 2025
Delhi Area Wise AQI
Anand Vihar: AQI 429 - Severe
Jahangirpuri: AQI 367 - Very Poor
Wazirpur: AQI 365 - Very Poor
ITO: AQI 353 - Very Poor
Ashok Vihar: AQI 350 - Very Poor
Burari: AQI 348 - Very Poor
Punjabi Bagh: AQI 344 - Very Poor
Sonia Vihar: AQI 329 - Severe
Shadipur: AQI 319 - Very Poor
Alipur: AQI 300 - Poor
Decision Support System (DSS) Analysis
Post-Diwali, the Decision Support System (DSS) for air quality management reported a shift in the mix of pollution sources. Major pollutants contributing to the worsening air include Particulate Matter (PM2.5 and PM10), Carbon Monoxide (CO), Sulphur Dioxide (SO₂), Nitrogen Dioxide (NO₂), and Ozone (O₃).
According to DSS data, the “others” category, representing unaccounted or out-of-inventory sources, made up the largest share (36.06 percent) of Delhi’s total emissions on Wednesday. The transport sector was the second-highest contributor (15.77 percent), followed by construction activities (2.18 percent), energy sector (1.61 percent), and waste burning (1.47 percent).
The industrial sector, including Delhi and surrounding NCR regions, contributed 3.49 percent, while stubble burning added 1.62 percent to Delhi’s PM2.5 levels. Stubble burning’s share had earlier peaked at 2.62 percent on October 17 before dropping due to changing wind patterns.
Neighbouring Districts Contribution In Delhi Pollution
Neighbouring districts such as Ghaziabad (5.28 percent), Jhajjar (5.11 percent), Gautam Buddha Nagar (4.01 percent), Gurgaon (2.08 percent), Bulandshahr (1.68 percent), and Panipat (0.86 percent) collectively contributed nearly 20 percent to Delhi’s pollution load, underscoring the regional nature of the air quality crisis.
ALSO READ: Bihar Weather Today: Major Shift Before Chhath, Temperature Drops In 18 Cities Including Patna
Delhi AQI On Oct 22
On Wednesday, Delhi’s 24-hour average AQI was recorded at 353 at 4 pm, according to CPCB data, the highest level so far this season. The figure marked a steady rise from 351 on Tuesday and 345 on Monday, indicating a worsening trend in the city’s air quality.